

Market research helps businesses decide where to launch products, how to price services, which customers to target, and whether a new market is growing or declining.
However, valuable research is not always published in the language used by the decision-making team.
A company exploring opportunities in Japan may receive local consumer reports in Japanese. A manufacturer evaluating Latin America may need Spanish or Portuguese industry studies. Investors may review government reports, competitor presentations, and market forecasts published across several languages.
These documents are commonly distributed as PDFs.
Translating the paragraphs can make the report easier to read, but market research contains more than narrative text. Charts, survey questions, sample descriptions, tables, footnotes, regional definitions, and forecast assumptions all contribute to the meaning.
If these elements are mistranslated or separated from their context, a business may reach the wrong conclusion even when the translated sentences appear fluent.
Why Market Research PDFs Require Special Care
A market research report may include:
- Executive summaries
- Consumer survey results
- Market-size estimates
- Growth forecasts
- Competitor comparisons
- Regional breakdowns
- Customer segments
- Pricing data
- Charts and graphs
- Methodology notes
- Sample descriptions
- Footnotes and source citations
- Risk factors
- Definitions and abbreviations
These elements are connected.
A percentage has little meaning without the survey question, sample size, region, and time period that produced it. A growth forecast may depend on assumptions described in a small footnote. A chart may compare revenue in millions while the surrounding paragraphs discuss individual customers.
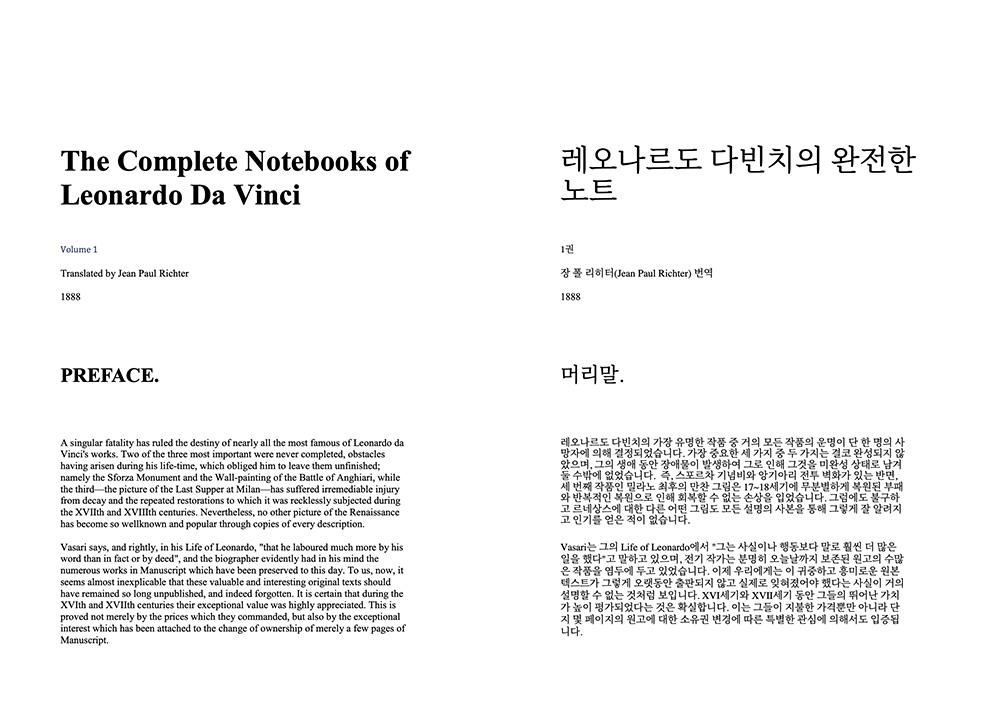
A layout-aware PDF translator can help preserve the connection between translated text, tables, charts, headings, and page structure. However, market research still requires careful interpretation and review.
Confirm the Report’s Purpose
Before translating the document, determine how the information will be used.
The report may support:
- Market-entry planning
- Product development
- Pricing decisions
- Competitor research
- Sales forecasting
- Investment analysis
- Customer segmentation
- Advertising strategy
- Supplier selection
- Regional expansion
The purpose determines which sections deserve the most attention.
A marketing team may focus on customer behavior and brand preferences. A finance team may prioritize market size, growth rates, and revenue projections. A product team may care more about feature demand and customer complaints.
Translating every page without identifying the decision behind the project can create unnecessary work and make the important findings harder to locate.
Verify the Source and Publication Date
Market data changes quickly.
Before translating a report, confirm:
- Full report title
- Publisher or research organization
- Publication date
- Data-collection period
- Geographic coverage
- Industry covered
- Document version
- Whether a newer edition exists
- Whether corrections have been published
A report released in 2023 may still appear authoritative while relying on data collected several years earlier.
The publication date and the research period are not always the same.
For example, a report published in January 2026 may summarize interviews conducted between April and August 2025. That difference matters when the market is changing rapidly.
Record both dates in the project notes so the translated findings are not presented as more current than they really are.
Understand the Research Methodology
A percentage should never be interpreted without understanding how it was calculated.
The methodology section may explain:
- Number of respondents
- Respondent age groups
- Geographic distribution
- Recruitment method
- Survey dates
- Interview format
- Statistical weighting
- Margin of error
- Excluded responses
- Definition of the target market
- Forecasting model
- Data sources
Consider the statement:
“62 percent of consumers prefer digital services.”
Before using that figure, the reader needs to know:
- Which consumers were surveyed?
- In which country or city?
- How many people participated?
- What did “digital services” include?
- Was the survey conducted online?
- Were older consumers underrepresented?
- Was the question multiple choice?
A fluent translation of the headline statistic cannot replace the methodological context.
Preserve Survey Questions Carefully
Survey results depend on the wording of the questions.
A small difference in language can change how respondents interpret a choice.
Consider these two questions:
“How likely are you to purchase this product?”
“Would you consider purchasing this product?”
They measure different levels of intent.
When translating survey questions, preserve distinctions such as:
- Likely versus interested
- Prefer versus use
- Aware versus familiar
- Satisfied versus very satisfied
- Purchase intent versus actual purchase
- Frequent use versus occasional use
- Necessary versus desirable
Response scales must also remain consistent.
For example:
- Strongly agree
- Agree
- Neither agree nor disagree
- Disagree
- Strongly disagree
The translated labels should retain the same order and intensity. Combining two response levels or weakening the wording can distort the interpretation of the results.
Check Sample Sizes and Percentages Together
Research reports frequently display percentages without repeating the sample size beside every chart.
A result based on 50 respondents should not be treated with the same confidence as one based on 5,000 respondents.
During translation, verify that:
- Sample sizes remain visible
- Percentages stay connected to the correct questions
- Regional subgroups are clearly identified
- Totals still add up correctly
- Rounding differences are explained
- “No response” categories remain present
- Multiple-choice questions are not mistaken for single-choice questions
Percentages in multiple-choice surveys may add up to more than 100 percent because respondents could select several answers.
If this explanation disappears from a footnote, readers may assume the data is incorrect.
Keep Tables Structurally Accurate
Market research tables may compare:
- Countries
- Regions
- Age groups
- Income levels
- Product categories
- Competitors
- Sales channels
- Historical years
- Forecast periods
Review each important table row by row and column by column.
Confirm that:
- Country names remain in the correct rows
- Years remain above the correct columns
- Historical and forecast data are clearly separated
- Currency units remain visible
- Percentages retain their symbols
- Decimal points remain accurate
- Negative growth remains negative
- Rankings preserve the correct order
- Table notes remain connected to the relevant data
- Longer translated labels do not cover figures
A well-formatted table can still produce a false conclusion if one heading shifts into the wrong position.
Review Charts as Evidence
Charts are often the most memorable part of a market report.
Decision-makers may rely on a single graph when presenting findings to colleagues, investors, or clients.
Charts may include:
- Titles
- Legends
- Axis labels
- Data labels
- Time periods
- Units
- Regional names
- Source notes
- Forecast indicators
- Confidence ranges
After translation, verify that:
- The chart title describes the correct metric
- Legend labels remain connected to the correct colors
- Axis units have not changed
- Years remain in chronological order
- Forecast periods remain visually distinct
- Percentages correspond to the correct categories
- Source information remains visible
- Notes explaining unusual results are preserved
Text embedded inside chart images may require separate recognition or image editing.
Translating the surrounding paragraph is not enough when the chart itself remains difficult for the target audience to understand.
Distinguish Market Size From Company Revenue
Reports may use similar monetary figures to describe very different concepts.
Common measures include:
- Total addressable market
- Serviceable available market
- Serviceable obtainable market
- Industry revenue
- Retail sales
- Manufacturer revenue
- Transaction value
- Customer spending
- Company revenue
- Gross merchandise value
These terms should not be treated as interchangeable.
A report stating that a market is worth $5 billion does not necessarily mean that suppliers collectively receive $5 billion in revenue. The figure may represent total consumer spending, transaction value, or an estimated future opportunity.
Create a terminology list for the financial and market-sizing concepts used in the report.
The approved translation should remain consistent across the executive summary, charts, tables, and conclusions.
Preserve Currency and Unit Information
International reports may present values in:
- US dollars
- Euros
- British pounds
- Japanese yen
- Chinese yuan
- Indian rupees
- Local currencies
- Thousands
- Millions
- Billions
A chart labeled “USD millions” should not be interpreted as individual dollars.
Currency symbols can also be ambiguous. The dollar sign may refer to US, Canadian, Australian, or another dollar-denominated currency.
Before using a figure, confirm:
- Currency
- Scale
- Exchange-rate date
- Whether values are nominal or inflation-adjusted
- Whether taxes are included
- Whether figures were converted by the publisher
Translation should not automatically convert currencies unless conversion is specifically required.
When conversions are added, retain the original figure and document the exchange rate used.
Preserve Regional Definitions
A term such as “North,” “Central,” “Tier 1 city,” or “urban consumer” may have a specific definition within the report.
The same regional label may mean different things in different countries or industries.
Review definitions for:
- Urban and rural areas
- Administrative regions
- Economic zones
- City tiers
- Income groups
- Customer segments
- Business sizes
- Age categories
- Product categories
Do not replace a local classification with a familiar term from another country unless the meanings are genuinely equivalent.
When a category has no exact translation, it may be safer to retain the original term and provide a brief explanation.
Treat Competitor Names and Product Categories Consistently
Market reports often compare companies, brands, and product categories.
These names should remain recognizable.
Prepare a glossary containing:
- Company names
- Brand names
- Product names
- Service categories
- Industry abbreviations
- Distribution channels
- Customer segments
- Regional terminology
- Words that should remain untranslated
Check official company websites or product materials when a recognized English or target-language name already exists.
Translating a brand name literally can make it difficult for readers to identify the actual competitor.
Separate Historical Data From Forecasts
A report may display historical and projected figures in the same chart.
The translated document must preserve the difference between:
- Recorded results
- Estimates
- Forecasts
- Scenarios
- Targets
- Analyst expectations
Words such as “expected,” “projected,” “estimated,” “may,” and “could” should not become definite claims.
For example:
“The market could reach $8 billion by 2030.”
This does not mean:
“The market will reach $8 billion by 2030.”
Forecasts depend on assumptions. Those assumptions may include economic growth, regulation, consumer adoption, technology costs, or competitive behavior.
Review the assumptions and risk sections before using forecast numbers in a business plan.
Check Footnotes Before Quoting Statistics
Footnotes often contain the information needed to interpret a headline figure.
They may explain:
- Data exclusions
- Currency conversions
- Rounding
- Sample limitations
- Changes in methodology
- Geographic exceptions
- Estimated values
- Definitions
- Survey dates
- Sponsor involvement
A chart may state that a category grew by 18 percent, while the footnote explains that the comparison excludes one region or uses a revised calculation method.
When translating or quoting a statistic, keep its relevant footnote with it.
Do not present a number without the qualification that determines its meaning.
Identify Sponsored Research
Some market reports are funded or commissioned by companies with an interest in the results.
Sponsored research is not automatically unreliable, but readers should understand who paid for the study and how the data was collected.
Check for:
- Sponsor names
- Research partners
- Disclosures
- Methodology ownership
- Survey recruitment sources
- Product comparisons
- Conflicts of interest
The translated document should preserve these disclosures.
A sponsor statement hidden in small text should not disappear simply because it is outside the main narrative.
Use Bilingual Output During Review
A translated-only PDF is convenient for executives and teams that only need the target language.
A bilingual or dual-column version is more useful during quality control.
It allows reviewers to compare:
- Survey questions
- Response scales
- Market terminology
- Chart labels
- Table headings
- Statistics
- Footnotes
- Forecast wording
- Regional definitions
- Missing paragraphs
A practical process is:
- Generate a bilingual review copy.
- Check the executive summary against the source.
- Review survey questions and methodology.
- Compare high-value tables and charts.
- Verify forecasts and assumptions.
- Confirm terminology with market specialists.
- Produce a translated-only PDF for wider distribution.
Teams processing this type of document for the first time can consult a practical PDF translation guide for an overview of OCR, layout recognition, language selection, and output options.
Assign the Right Reviewers
Market research should not be reviewed only by a language specialist.
Different reviewers can focus on different risks.
A language reviewer can check:
- Grammar
- Readability
- Tone
- Terminology consistency
- Survey wording
A market specialist can check:
- Industry terms
- Customer segments
- Competitor names
- Regional definitions
- Commercial interpretation
A data reviewer can check:
- Tables
- Percentages
- Sample sizes
- Growth rates
- Currencies
- Forecasts
A document reviewer can check:
- Page order
- Chart placement
- Footnotes
- Text overflow
- Missing elements
- Visual consistency
The final decision-maker should confirm that the translated evidence supports the conclusion being presented.
Create a Market Research Translation Checklist
Before translation:
- Confirm the publisher, date, version, and research period.
- Define the business decision the report will support.
- Review the methodology and sample.
- Identify tables, charts, footnotes, and scanned pages.
- Prepare a glossary of market and regional terms.
- Record company names and categories that must remain unchanged.
After translation:
- Compare survey questions and response scales.
- Verify sample sizes and percentages.
- Review tables row by row.
- Check chart titles, legends, and units.
- Preserve currency and scale information.
- Confirm regional definitions.
- Separate historical data from forecasts.
- Review assumptions and limitations.
- Keep important footnotes with the relevant statistics.
- Use bilingual output for high-risk sections.
- Obtain language, market, and data approval.
Final Thoughts
Translating market research is not simply a language exercise.
The value of the document depends on whether readers can accurately interpret its sample, definitions, data, charts, assumptions, and limitations.
AI-assisted PDF translation can reduce the work required to extract text and reconstruct complex pages. Human review remains necessary when the findings will influence investment, pricing, product development, or international expansion.
The best translated market report does not merely sound professional.
It allows the target-language reader to reach the same evidence-based understanding as someone reading the original document.